
Figure 5.
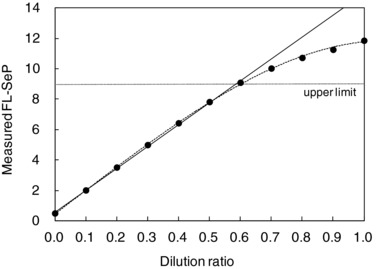
Serum sample containing about 15 mg/l of full‐length selenoprotein P (FL‐SeP) was diluted with sample diluent in 10 stages. The linearity curves (…) were constructed by plotting the measured FL‐SeP (mg/l; mean value of triplicates) on the y‐axis vs. dilution ratio on the x‐axis. The regression line (—) was constructed by the linear regression analysis of seven dilution ratios between 0.0 and 0.6.