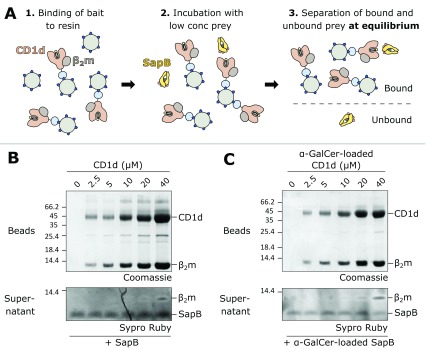
Figure 2. Equilibrium binding assay of CD1d-β 2m and SapB.
A. Schematic diagram illustrating the equilibrium binding assay protocol. B. Increasing concentrations of CD1d-β 2m were bound to beads and detected by Coomassie-stained SDS-PAGE. After incubation with SapB, unbound SapB was detected in supernatants by SYPRO Ruby-stained SDS-PAGE. C. As for panel B but with CD1d-β 2m and SapB both pre-loaded with the lipid α-GalCer.

