Figure 2.

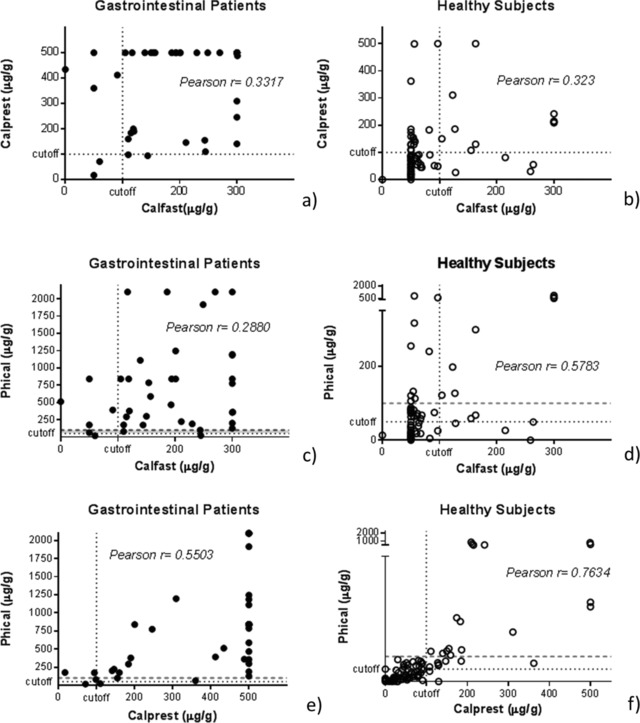
Diagnostic agreement in calprotectin measures between POCT and ELISA methods in GI patients (a, c, e) and healthy subjects (b, d, f). Dashed lines indicate adopted cutoffs; dotted red lines indicate suggested cutoff of 100 μg/g for Phical.

Diagnostic agreement in calprotectin measures between POCT and ELISA methods in GI patients (a, c, e) and healthy subjects (b, d, f). Dashed lines indicate adopted cutoffs; dotted red lines indicate suggested cutoff of 100 μg/g for Phical.