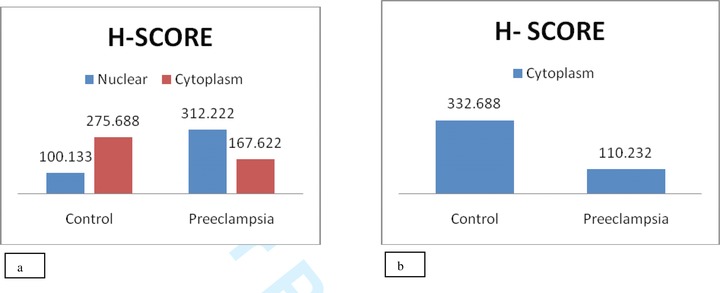
Figure 2.

Comparison of immunohistochemical H‐score analysis. (A) HIF‐1α expression in cytoplasm and nucleus of syncytiotrophoblast cells of control and preeclamptic patients. (B) PIGF expression in cytoplasm of syncytiotrophoblast cells of control and preeclamptic group.
