
Figure 4.
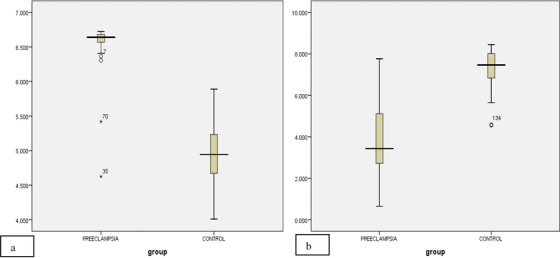
Box plot showing the serum concentration (pg/ml) of (A) HIF‐1α and (B) PIGF in control and preeclamptic patients. The solid bar indicates median, upper, and lower limits of box, 75th and 25th percentiles; upper and lower bars, maximum and minimum values (P < 0.05).