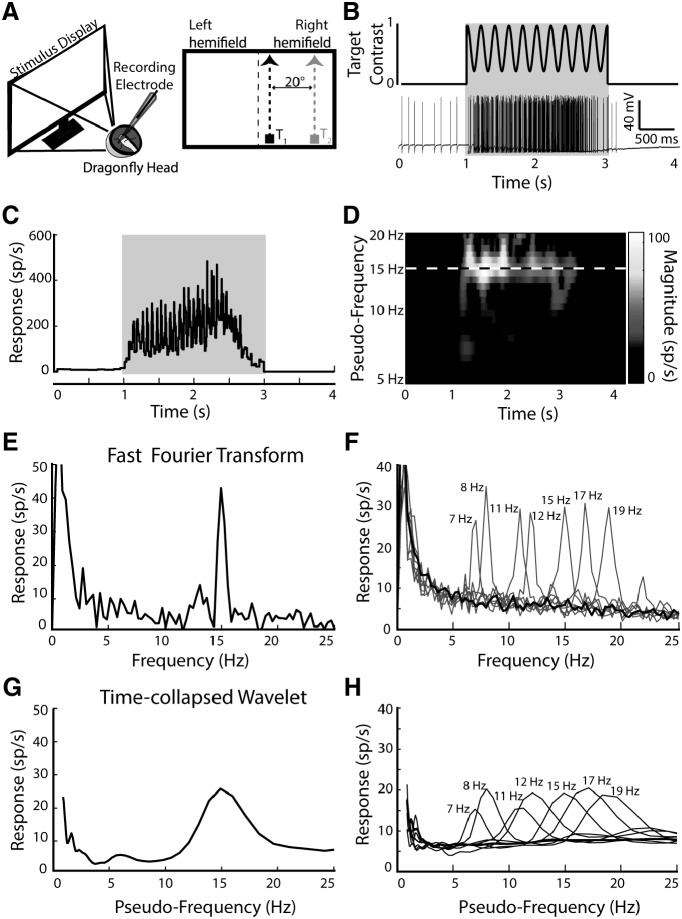
Figure 1.
The frequency of the tagged target is preserved in the intracellular responses of CSTMD1. A, Left, Intracellular in vivo electrophysiology involves inserting an electrode into the intact brain to record single-neuron responses to stimuli presented on a computer screen. Right, Stimulus pictogram, a single small target (black) ascends CSTMD1's excitatory receptive field. Relative positions of T1 (black) and T2 (gray) indicated. B, Top, Frequency tagging involves modulating the contrast of the stimulus over time at a specific frequency (5 Hz in this illustrative pictogram). Bottom, An example spike train in response to a stimulus modulated at 15 Hz, presented at 1 s for a duration of 2 s. C, The inverse interspike interval (ISI) is calculated to determine the spike rate over time. This calculation provides a continuous signal that is amenable to frequency-domain analysis. D, A continuous wavelet transform of the signal in C showing magnitude across time and pseudo-frequency (Logarithmic) reveals response magnitude at a range of pseudo-frequencies over time. In this example, power is centered around 15 Hz for the duration of the trial. E, A Fast Fourier Transform of the signal in C reveals a distinctive peak at 15 Hz, corresponding to the frequency tagged stimulus. F, Averaged FFT of responses to trials of varying frequency (n = 119 trials across 4 dragonflies) G) The output of the wavelet analysis in D, collapsed across time to be visually comparable to the FFT in E. H, Averaged time-collapsed continuous wavelet transform for the same data presented in F, which although less peaked, still reveals statistically distinctive responses at the relevant frequencies.

