Figure 2.
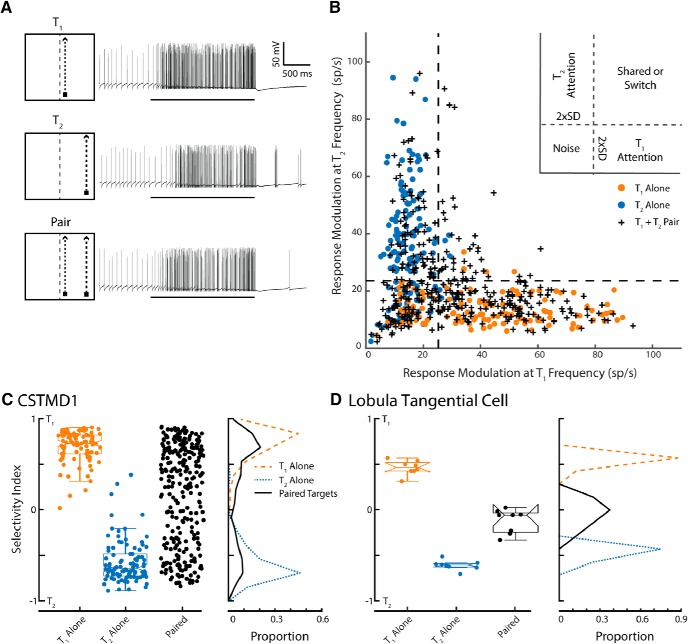
Frequency tagging identifies the selected target in a paired-target trial. A, Illustrative pictograms and corresponding single-trial electrophysiological responses for the three stimulus conditions. From top to bottom: T1 alone, T2 alone, paired targets. B, The response modulation at the T2 frequency plotted against response modulation at the T1 frequency. Data are plotted in response to either a single target at the T1 location (orange dots) or at the T2 location (blue dots) when presented alone. Crosses represent CSTMD1 responses to the paired stimulus (total n = 447 trials across 13 dragonflies). Dashed lines indicate the derived noise threshold. Responses to the paired-targets mostly elicit modulation at either one or other of the target flicker frequencies (not both together), indicative of selective attention. C, The selectivity index represents the degree to which the response is locked to one of the frequency tagged stimuli over the other. Values around zero indicate that both frequencies are equal components of the overall modulation. Frequency polygons illustrate the relative proportion of these points, with the bimodal distribution to the paired stimulus clearly revealing the selection of one target or the other. D, In comparison, results from a lobula tangential cell (an optic flow sensitive neuron) in the dragonfly show no selective attention (n = 8 trials in 1 dragonfly), with a unimodal distribution around zero to the paired-targets, indicative of the expected shared modulation to both target frequencies (neuronal summation rather than selection).

