Figure 6.
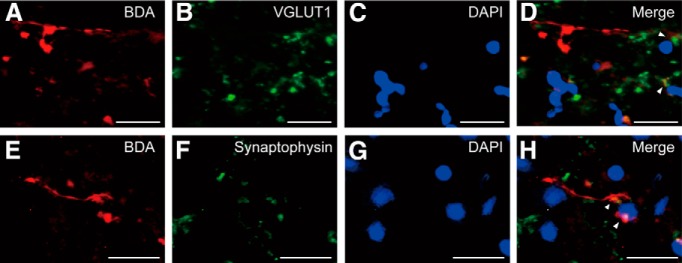
Functional synapses between ip-PMv projections and ip-FN neurons. A–D, Multi-staining study with VGLUT1 in Monkey D. A, BDA; B, VGLUT1; C, DAPI; D, merged image (BDA, red; VGLUT1, green; DAPI, blue). Arrowheads indicate consistent colocalization of BDA with VGLUT1. E–H, Multi-staining study with synaptophysin in Monkey D. E, BDA; F, synaptophysin; G, DAPI; H, merged image (BDA, red; synaptophysin, green; DAPI, blue). Arrowheads indicate consistent colocalization of BDA with synaptophysin. Scale bars: A–H, 20 μm.

