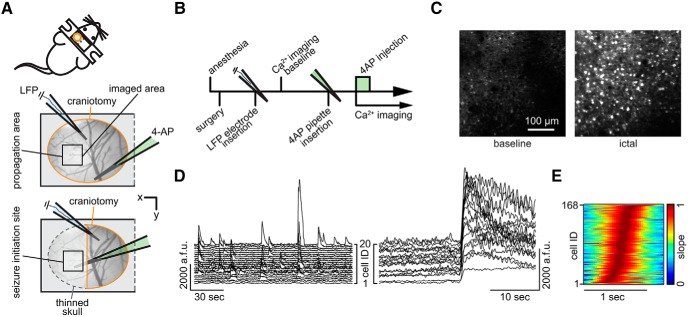
Figure 1.
Imaging in the seizure initiation site and propagation area. A, Experimental setup. Two surgical approaches over left somatosensory cortex; craniotomy encircled in orange, thinned skull in dotted gray, black squares indicate imaged FOV; each experiment (exp.) involved the insertion of two glass micropipettes, one (blue) containing a silver chloride silver for LFP recording, the other (green) containing 4-AP (15 mm, injection vol. 500 nl, total amount delivered = 7.5nmol). B, Experimental workflow. C, Propagation area, representative 3 s average (avg) fluorescence images of neural activity (GCaMP6s) during baseline and ictal break-in. D, Calcium (Ca2+) transients of 20 representative cells during baseline conditions (left) and during ictal invasion of the propagation area (right). a.f.u., Arbitrary fluorescent units. E, Propagation area, representative example of the arriving ictal wavefront. Normalized first derivative of each registered neuron's fluorescent trace during electrographic seizure onset is shown. Cell recruitment to ictal activity ordered in time by maximum slope. Note the s-curved shape of cell recruitment highlighting sufficient temporal imaging resolution for individual cellular recruitment.

