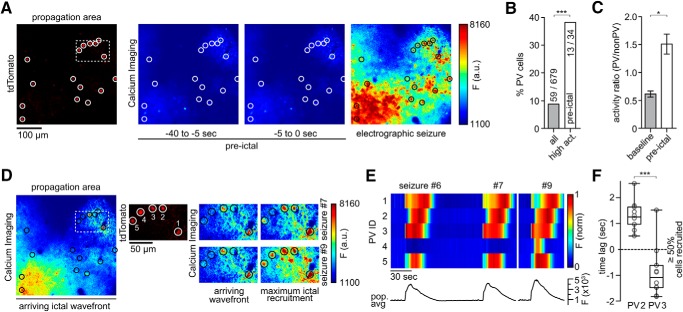
Figure 4.
Ictal recruitment of PV interneurons in the propagation area. A, Left to right, tdTomato-positive parvalbumin-containing interneurons (PVs, encircled), imaged at 990 nm; Ca2+ imaging (at 940 nm): fluorescence avg. images during pre-ictal period and ictal activity. B, PV percentage among highest active neurons during pre-ictal period (n = 4 experiments, total number of pre-ictal periods = 30 [7.5 ± 1.85 SEM], all imaged non-PVs = 620, PVs = 59, top 5% activity cells = 34) compared with general subtype distribution (χ2 test p(χ2 > 39.381) < 0.001). C, Activity ratio of PV versus non-PV subpopulations during baseline and the 40 s period before seizure onset. Activity ratios were obtained by dividing frame-subpopulation-averaged positive change of Ca2+ fluorescence. During baseline (left), PVs continually display lower values than non-PVs. During the pre-ictal period (right), this relationship is inverted (n = 4 exp., GCaMP6s, 30 pre-ictal periods, Mann–Whitney test p = 0.0286). D, Same exp. as in A, during ictal break-in (left); middle and right side: insert shown in A and D (dotted box). Displayed are 5 immediately neighboring PVs and their Ca2+ transients during ictal break-in and sustained ictal activity across 2 successive seizures (upper and lower panel, see also Movies 4 and 5). Note the diverse PV recruitment to ictal activity with PV #1 and #3 bursting ahead of the arriving ictal wavefront, PV #2 and #5 showing delayed recruitment (intraictal section), and one nonparticipant PV (#4) during the first seizure. The latter cell is clearly recruited to a successive ictal event. E, Bottom, Population avg. Ca2+ fluorescence signal of all 124 registered cells from exp. shown in A and D across 3 seizures (#6, 7,and 9). Top, Max-normalized Ca2+ fluorescence for the 5 PVs highlighted in D, shown across 3 seizures. Note the differential recruitment on the order of seconds of even immediately neighboring PVs. PV #4 does only show a clear Ca2+ signal in the last seizure displayed (F) Differential relative recruitment (Time lag with respect to the 50% recruitment frame) of immediately neighboring PV #2 and #3 (intercell distance <50 μm, both cells are located far from the arriving ictal wavefront within the imaged area) across all seizures of the exp. (10 seizures, Mann–Whitney test p < 0.001). Boxes represent 25th to 75th percentile of cellular recruitment, bands inside boxes display median cell recruitment time points, circles represent cell recruitment time lag for individual seizures. Depiction of statistical significance for Figure 4: *p < 0.05; ***p < 0.001.

