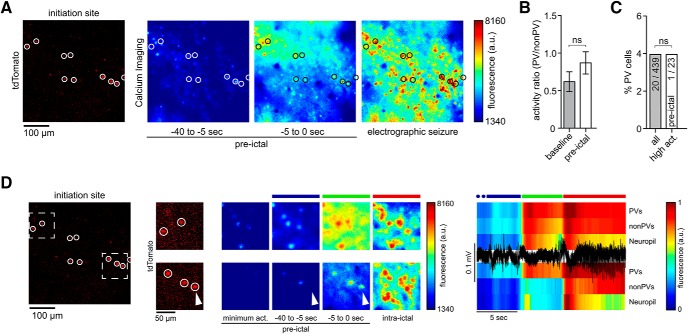
Figure 5.
Ictal recruitment of PV interneurons in the seizure initiation site. A, Left, tdTomato-positive parvalbumin containing interneurons (PVs, red, encircled) imaged at 990 nm; Ca2+ imaging (at 940 nm): fluorescence avg. images of pre-ictal and ictal neural activity. B, Activity ratio of PV versus non-PV subpopulations during baseline and the 40 s period before LFP seizure onset. Activity ratios were obtained by dividing frame-subpopulation-averaged positive change of Ca2+ fluorescence (n = 3 exp., all imaged non-PVs = 439, all PVs = 20, 23 pre-ictal periods). During baseline (left), PVs continually displayed lower values than non-PVs. This relationship was preserved during the pre-ictal period (right, Mann–Whitney test p = 0.4). ns = not significant. C, PV percentage among highest active neurons during pre-ictal period (n = 3 exp., 23 pre-ictal periods, top 5% activity cells = 23) compared with general subtype distribution (χ2 test P(χ2 > 0.002) = 1.0151). ns = not significant. D, Same exp. as in A with 2 magnified inserts (see also Movies 6 and 7) within distinct intrafocal subterritories. Ca2+ imaging during saltatory micro-epileptic progression (middle); note again the diverse recruitment of PVs to ictal activity (arrowhead). Colored bars above the Ca2+ avg. images correspond to the colored bars above the LFP trace (black) and population avg. Ca2+ traces (PVs, non-PVs and Neuropil) on the right.

