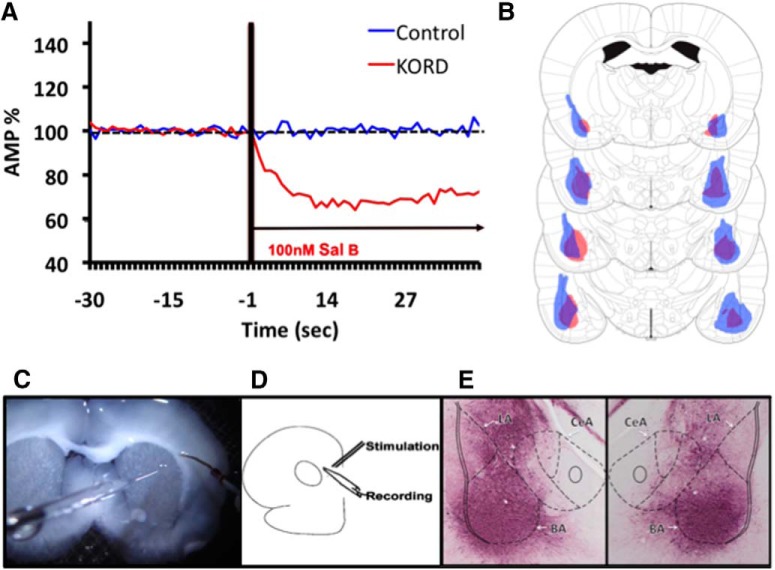
Figure 4.
A, Responses of cells during a baseline period and following Sal-B treatment. B, The minimum (red) and maximum (blue) extent of viral expression for subject animals treated with KORDs at the 1.56, 2.04, 2.64, and 3.24 mm posterior to bregma (images adapted from Paxinos and Watson, 2013). C, An image of a coronal section being tested for responses. D, The location of stimulating and recording electrodes can be seen in this image as well as the in schematic. E, A representative coronal section expressing KORD in BA using very intense purple (VIP).

