
Figure 3.
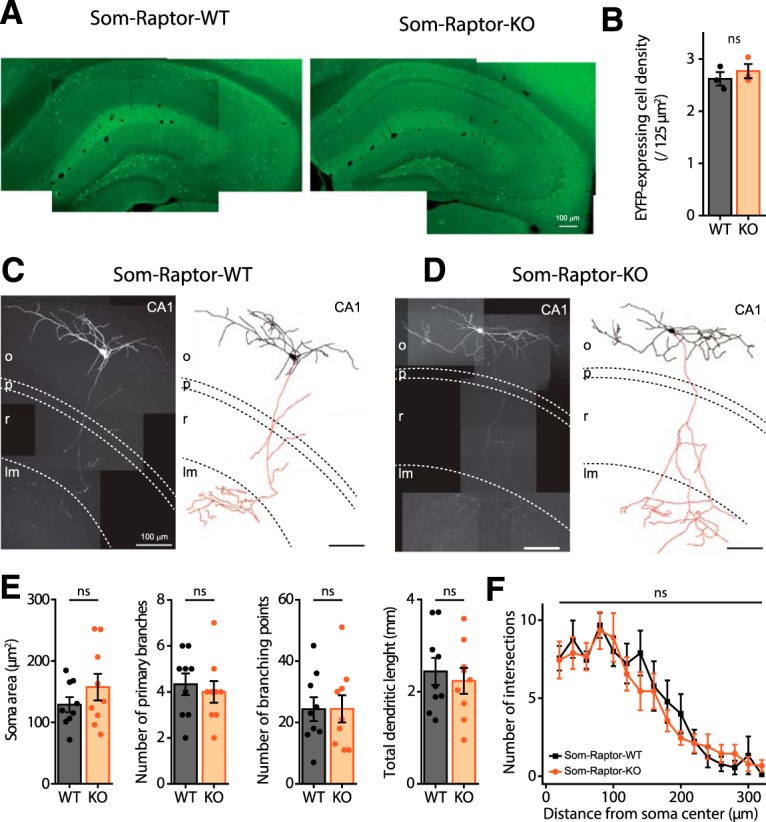
Intact SOM interneuron numbers and morphology in Som-Raptor-KO mice. A, Montage of representative fluorescence images of EYFP expression in Som-Raptor-WT (left) and Som-Raptor-KO (right) mice. B, EYFP-expressing cell density in CA1 of Som-Raptor-WT and Som-Raptor-KO mice. C, D, Montage of representative confocal images, maximum intensity z-projection (100 stacked images, 1 μm steps) of hippocampal CA1 SOM-IN filled with biocytin (left) and reconstructions (soma and dendrite in black, axon in red; right) from Som-Raptor-WT (C) and Som-Raptor-KO (D) mice. As illustrated, the vast majority (90%) of EYFP-expressing SOM-INs recorded in whole-cell and filled with biocytin in the present study corresponded to the O-LM type of SOM-INs (the remaining 10% corresponding to bistratified cells and projection cells). The dashed lines indicate the approximate boundaries of strata oriens (o), pyramidale (p), radiatum (r), and lacunosum/moleculare (lm). E, Somatic and dendritic morphometric parameters of biocytin-filled SOM-INs in Som-Raptor-WT and Som-Raptor-KO mice. F, Sholl analysis of dendritic arborization of reconstructed SOM-INs (20 μm bins) in Som-Raptor-WT and Som-Raptor-KO mice. ns, not significant.