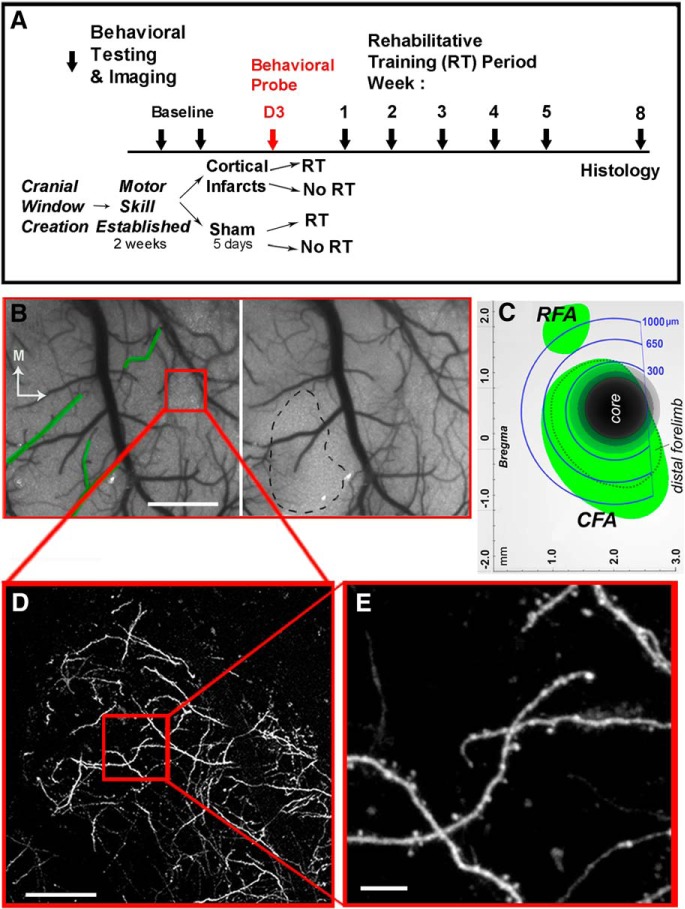
Figure 1.
Experimental design. A, Experimental time course. Block arrows indicate time points of imaging sessions and behavioral probes. B, Speckle contrast image of cortical surface vasculature just before (left) and 10 min following (right) artery-targeted photothrombosis. Green outlines indicate targeted arterioles. Black dashed line indicates the infarct core, as defined by the region with < 20% baseline CBF 10 min after stroke onset. Red box represents a dendritic sample region. Scale bar, 1 mm. C, Schematic diagram of imaging zones relative to the ischemic core and to caudal (CFA) and rostral (RFA) forelimb areas defined previously from intracortical microstimulation mapping (Tennant et al., 2011). D, Low-magnification image of GFP-labeled dendrites in the sample imaging location. Scale bar, 100 μm. E, High-magnification image of the sampling region. Scale bar, 10 μm.

