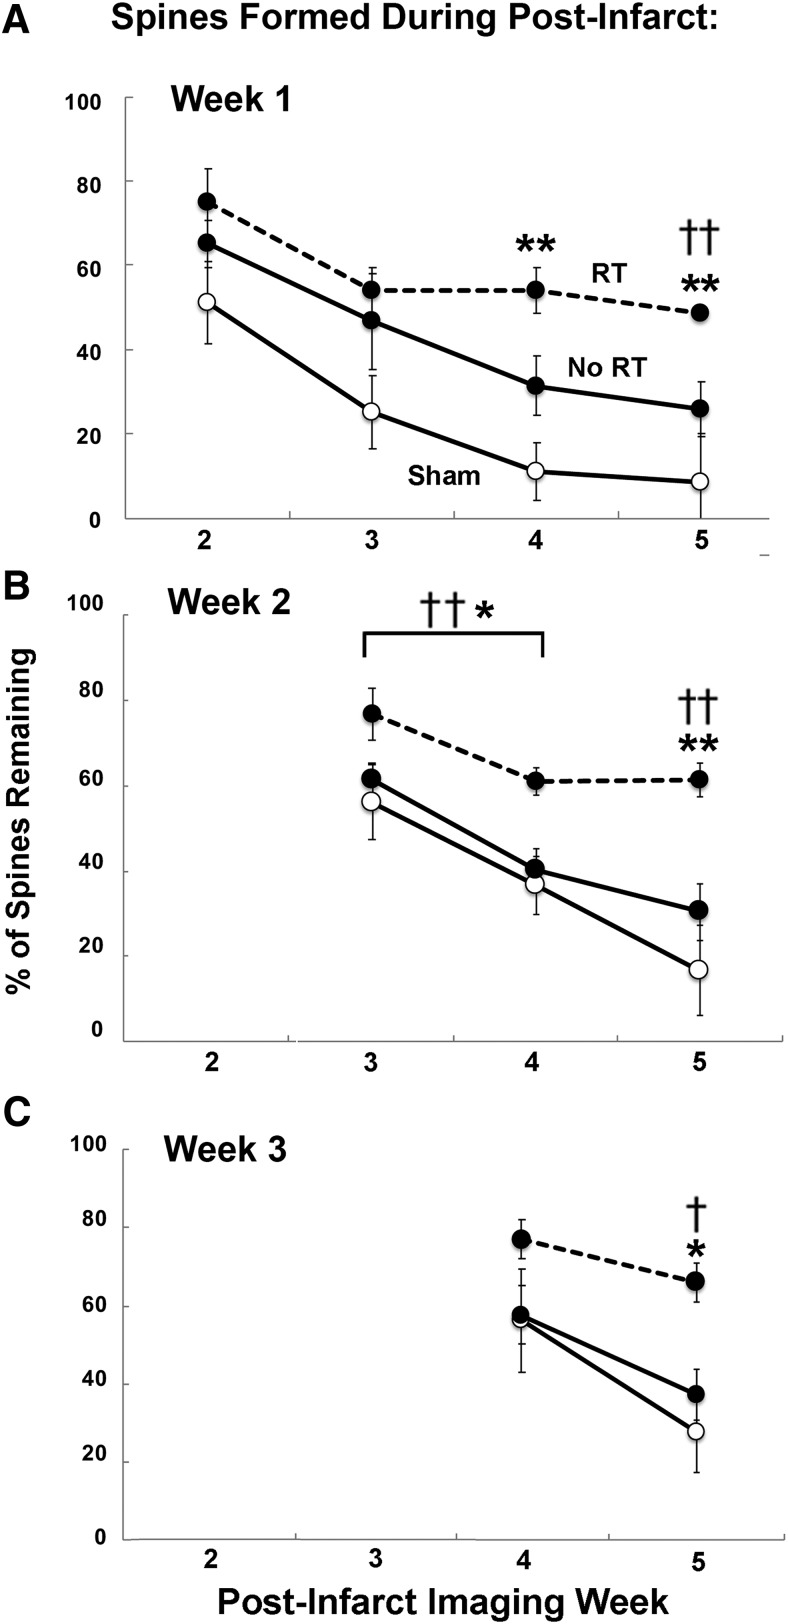
Figure 5.
Long-term maintenance of spines formed during postinfarct weeks 1–3 was greater with RT. A, Percentage of new spines formed during postinfarct week 1 that remained in weeks 2–5. A greater percentage of spines persisted to the final time point in the RT group compared with No RT and Sham. B, The percentage of spines formed during week 2 that persisted in weeks 3–5 was greater overall in RT compared with No RT and Sham (for details, see text). C, The percentage of spines formed during week 3 that remained at week 5 was greater in RT compared with No RT and Sham. Data are mean ± SE. †p < 0.05, RT versus No RT. ††p < 0.01, RT versus No RT; *p < 0.05, RT versus Sham. **p < 0.01, RT versus Sham.

