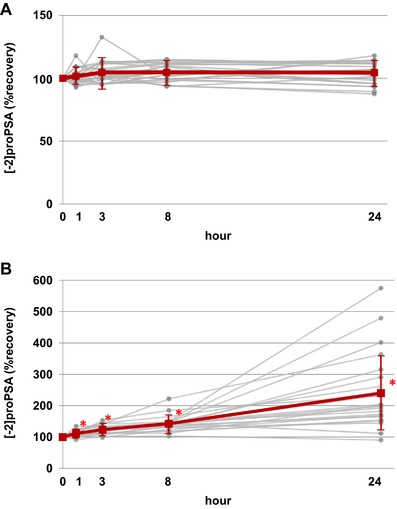
Figure 1.

Time course of percentage recovery of [−2]pro‐PSA (where PSA is prostate‐specific antigen) in serum (A) and whole blood (B) at room temperature. Gray lines indicate individual values, and the red line indicates mean ± SD. *P < 0.05 compared with baseline value.
