
Figure 3.
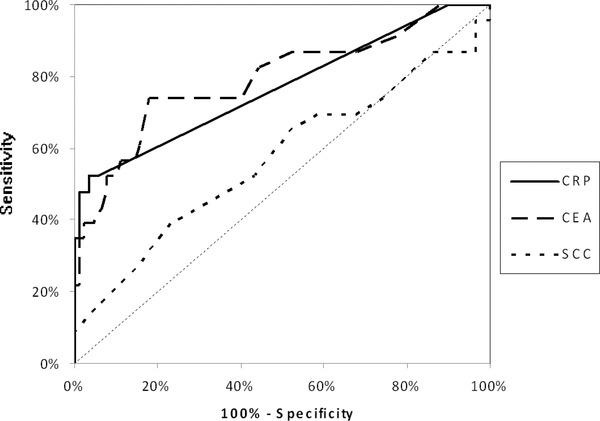
The areas under ROC curves (AUC) for C‐reactive protein (CRP = 0.7686, P < 0.001), carcinoembryonic antigen (CEA = 0.7944, P < 0.001), and squamous cell cancer antigen (SCC‐Ag = 0.5696, P = 0.3522) in patients with adenocarcinoma of esophagus (AC).