Fig. 2.
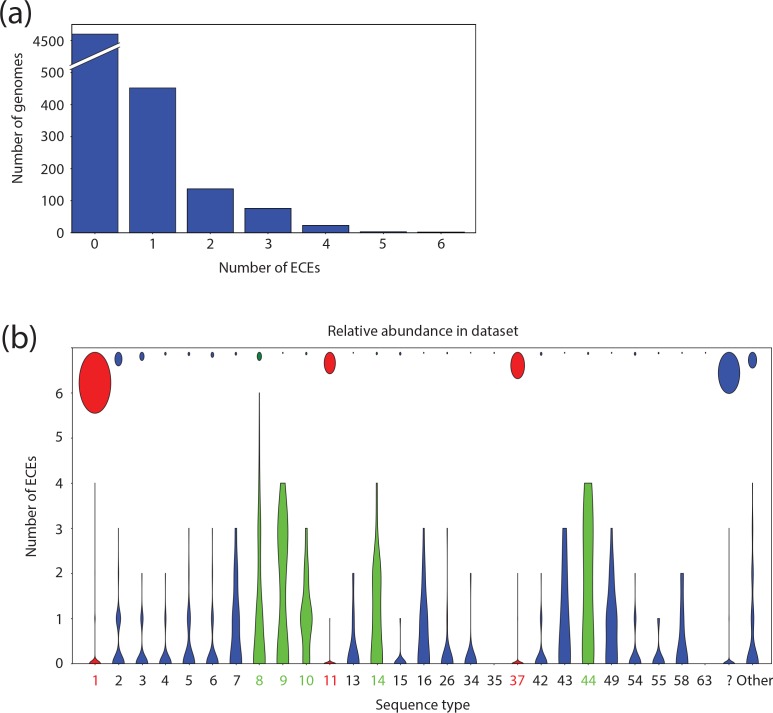
ECEs of C. difficile . (a) Number of ECEs per strain. (b) Distribution of the number of ECEs amongst various STs of C. difficile . The violin plots indicate the distribution of plasmids for a particular ST (in the figure ST1/1* is indicated as ‘1’), whereas the circles indicate the relative number of sequenced genomes for a particular ST. Only STs with 20 or more sequenced genomes are displayed separately. All other STs are summarized under ‘other’. Genomes to which no ST could be assigned are summarized under ‘?”. The STs belonging to the hypervirulent ribotypes RT27 (ST1) and RT078 (ST11), as well as the widely sequenced ST37, are marked in red. STs with more than one plasmid per genome on average are marked in green.

