
Figure 2.
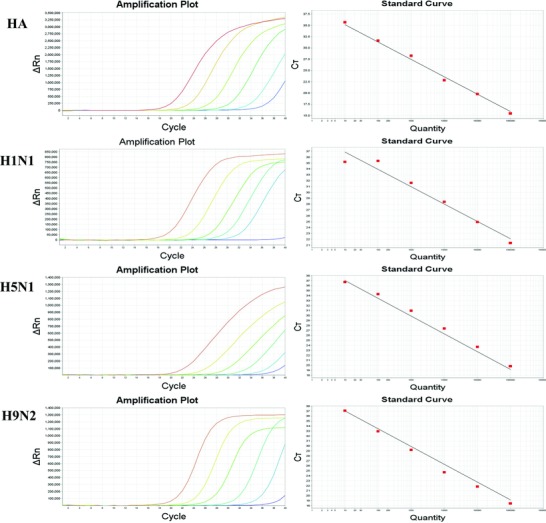
Standard curve of each virus of the RT‐PCR array. Tenfold dilution series of RNA virus like particles (from 105–101 copies/μl) was plotted against the threshold cycle. The coefficient of determination (R2) and equation of regression curve (y) calculated.