
Figure 2.
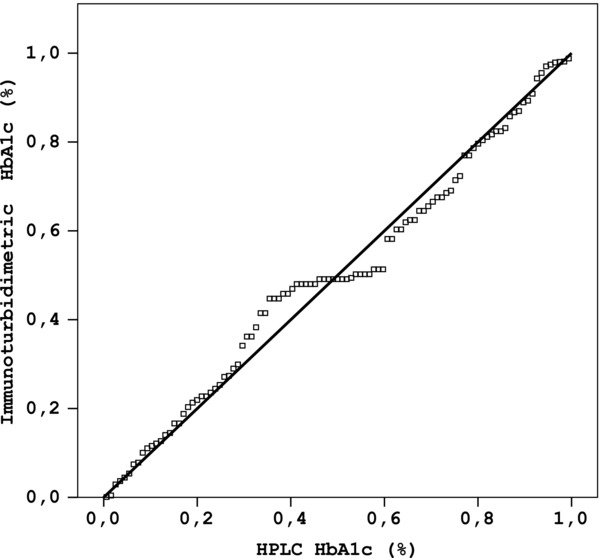
Method comparison plot for the determination of HbA1c using Roche Tina‐quant second generation (TINIA) and Adams HA‐8160 (HPLC) (y = 1.091x – 0.363; r 2 = 0.96).
Official websites use .gov
A
.gov website belongs to an official
government organization in the United States.
Secure .gov websites use HTTPS
A lock (
) or https:// means you've safely
connected to the .gov website. Share sensitive
information only on official, secure websites.
Method comparison plot for the determination of HbA1c using Roche Tina‐quant second generation (TINIA) and Adams HA‐8160 (HPLC) (y = 1.091x – 0.363; r 2 = 0.96).