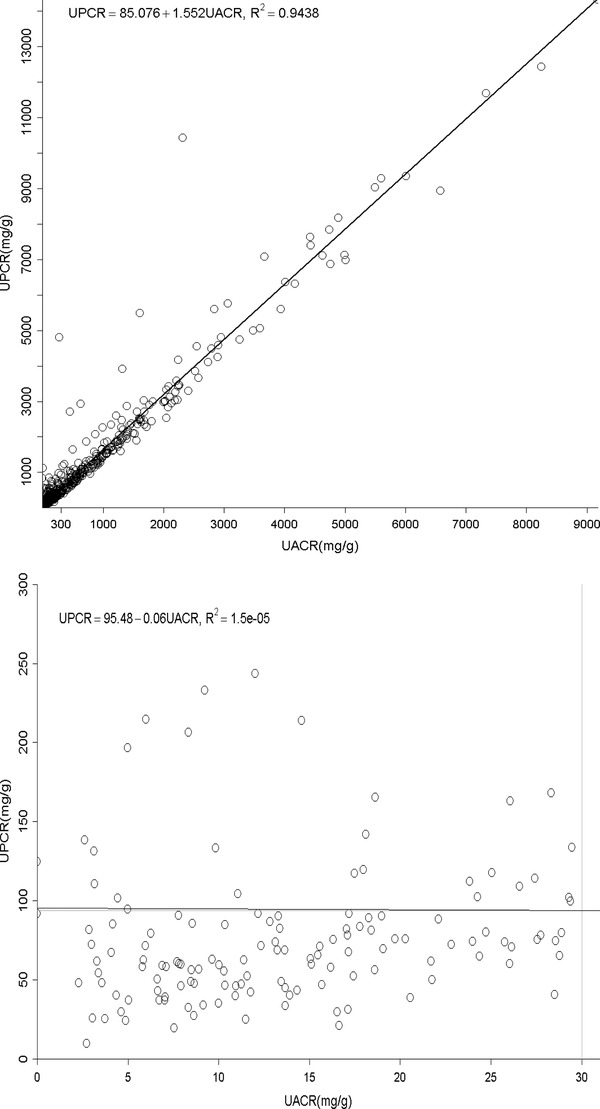
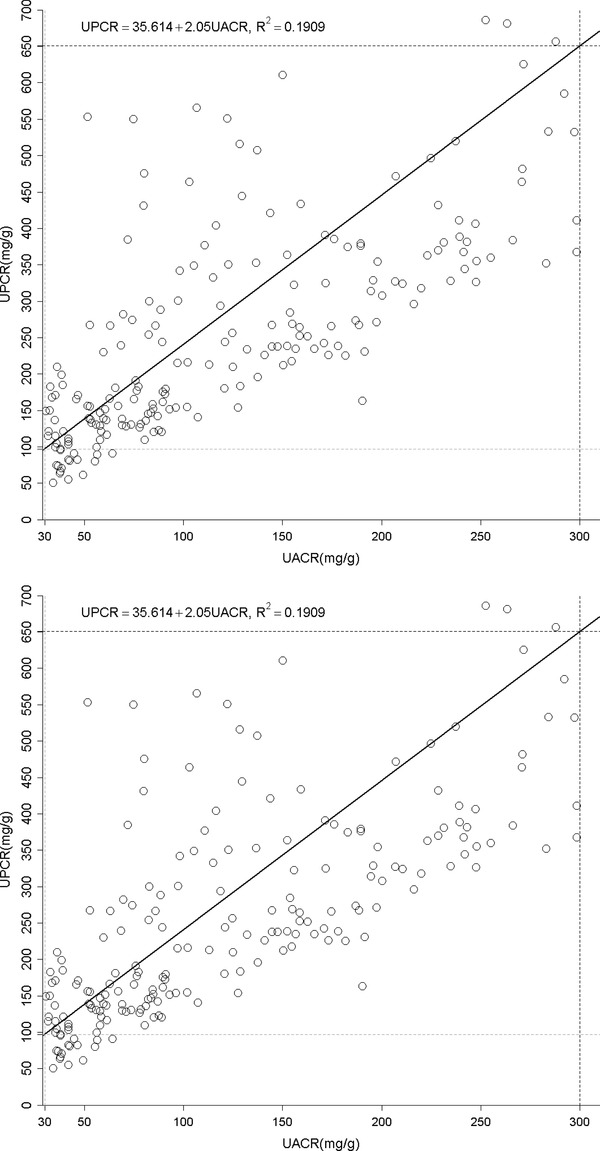
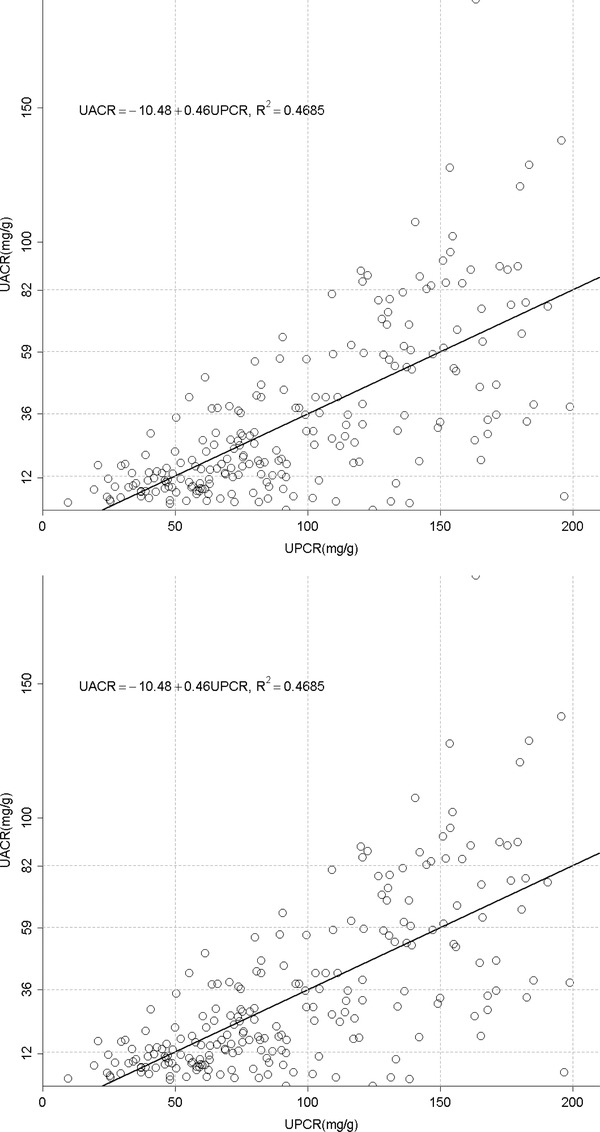
Figure 1.

(A) The relationship between urine albumin to creatinine ratio (UACR) and total protein to creatinine ratio (UPCR) of all albuminuria range. (B) The relationship between urine albumin to creatinine ratio (UACR) and total protein to creatinine ratio (UPCR) of normal albuminuria range (<30 mg/g). (C) The relationship between urine albumin to creatinine ratio (UACR) and total protein to creatinine ratio (UPCR) of microalbuminuria range (30–300 mg/g). (D) The relationship between urine albumin to creatinine ratio (UACR) and total protein to creatinine ratio (UPCR) of macroalbuminuria range (>300 mg/g). (E) The relationship between urine total protein to creatinine ratio (UPCR) and albumin to creatinine ratio (UACR) when UPCR < 200 mg/g. (F) The relationship between urine total protein to creatinine ratio (UPCR) and albumin to creatinine ratio (UACR) when UPCR >200 mg/g.


