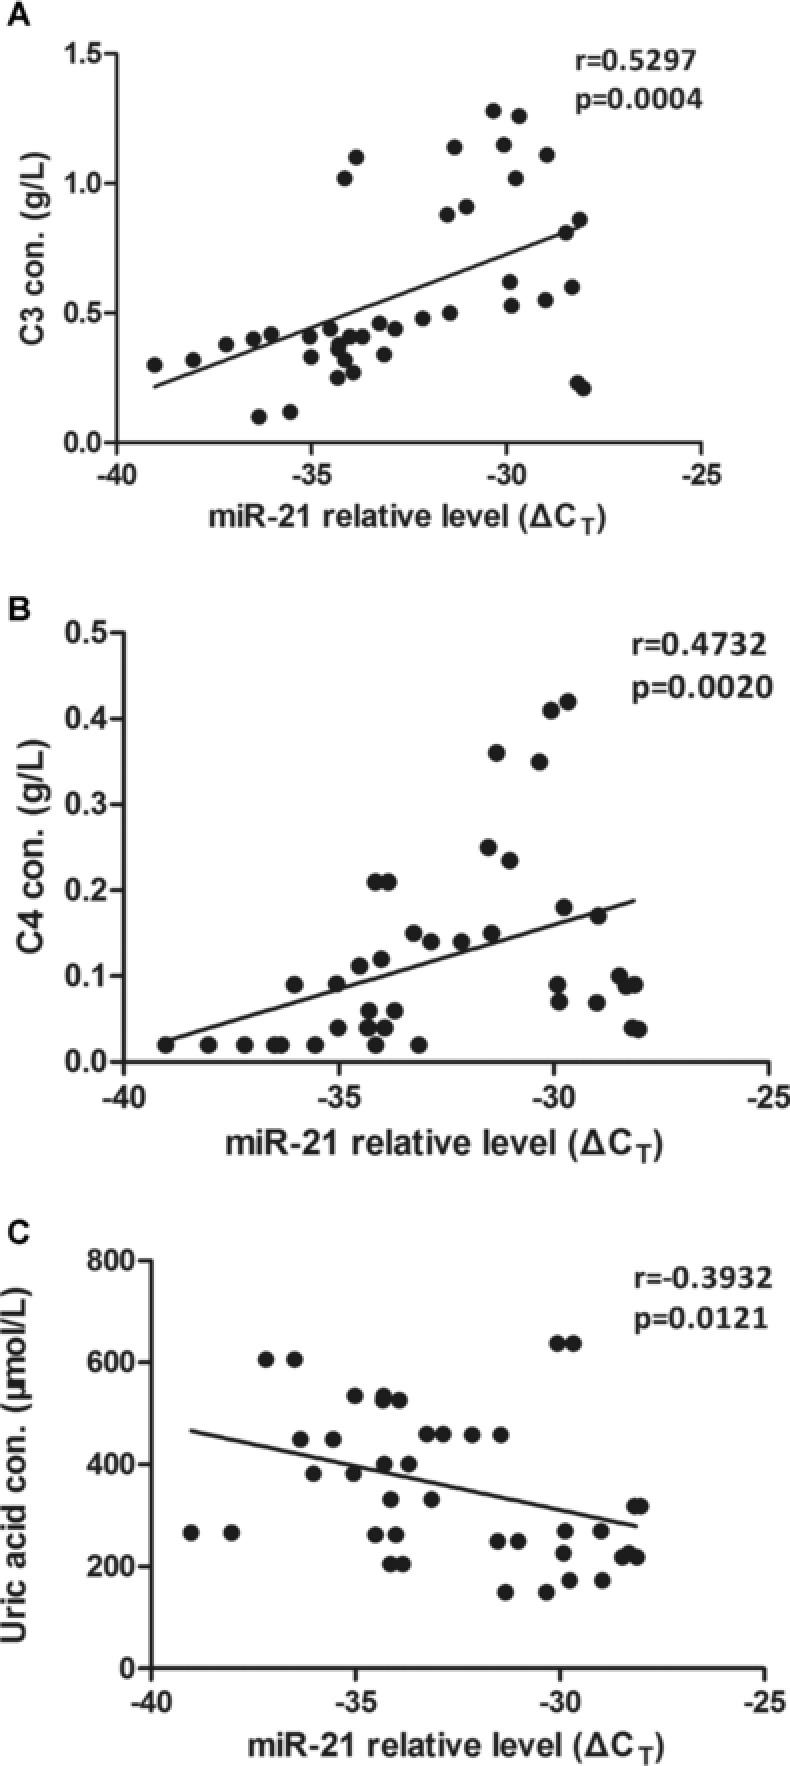
Figure 3.

Correlations between plasma miR‐21 and clinical characteristics of SLE. The results were from the analysis by Spearman's rank correlation coefficient. (A) Decreased miR‐21 (increased ΔCT) correlated with C3. (B) Association between C4 and plasma miR‐21. (C) Correlation between plasma miR‐21 and uric acid. Con., concentration
