
Figure 2.
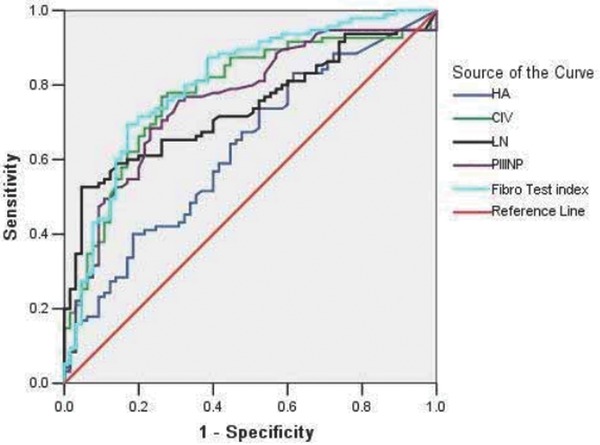
ROCcurves for the diagnosis of liver fibrosis (≥S1) via five indices. The AUCs of the fibrosis diagnostic indices were ranked in the following order: FibroTest (0.80) > CIV (0.771) > PIIINP (0.755) > LN (0.738) > HA (0.626), and the boundary values that were estimated by the ROC curves to indicate liver fibrosis were −0.28, 42.05 ng/ml, 6.75 ng/ml, 88.65 ng/ml, and 22.1 ng/ml, respectively.