
Figure 3.
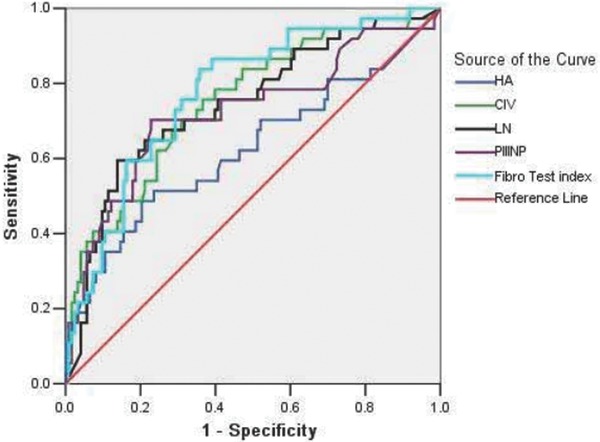
ROC curves for the diagnosis of cirrhosis (S4) via five indices. The AUCs of the ROC curves were ranked in the following order: FibroTest (0.776) > CIV (0.752) > LN (0.745) > PIIINP (0.725) > HA (0.625). In addition, the boundary values that were estimated by the ROC curves to indicate cirrhosis were −0.22, 60.6 ng/ml, 126.5 ng/ml, 9.9 ng/ml, and 91.15 ng/ml, respectively.