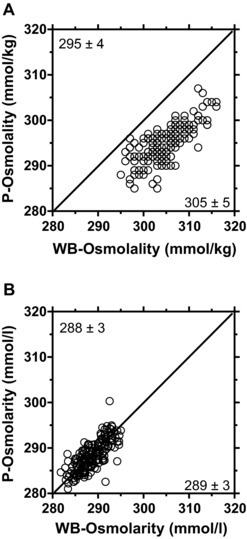
Figure 1.

Relationship between whole blood (x‐axis) and plasma (y‐axis) osmolality (A) and osmolarity (B). The solid line represents the line of identity where y = x. The correlation coefficient was 0.75 for both panels (A) and (B). P, plasma; WB, whole blood. Values in the figure corners are the mean ± standard deviation for the x‐ and y‐axis data.
