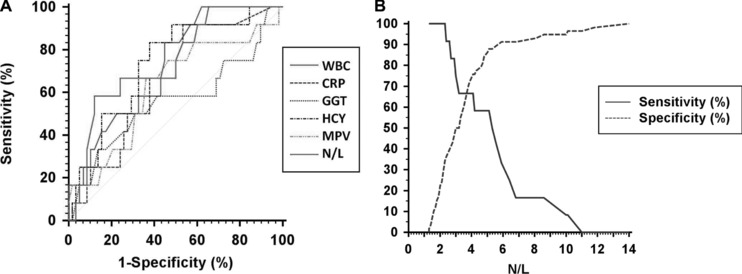
Figure 1.

(A) A plot for comparison of ROC curves among WBC, CRP, GGT, HCY, MPV, and N/L variables. AUC values were 0.73 (0.61–0.83), 0.65 (0.53–0.76), 0.56 (0.43–0.68), 0.73 (0.61–0.83), 0.62 (0.50–0.74), 0.74 (0.62–0.84), respectively, and there were not any significant difference between any two AUC values (P > 0.05). (B) A plot to show the determination of the optimal cut‐off value for N/L.
