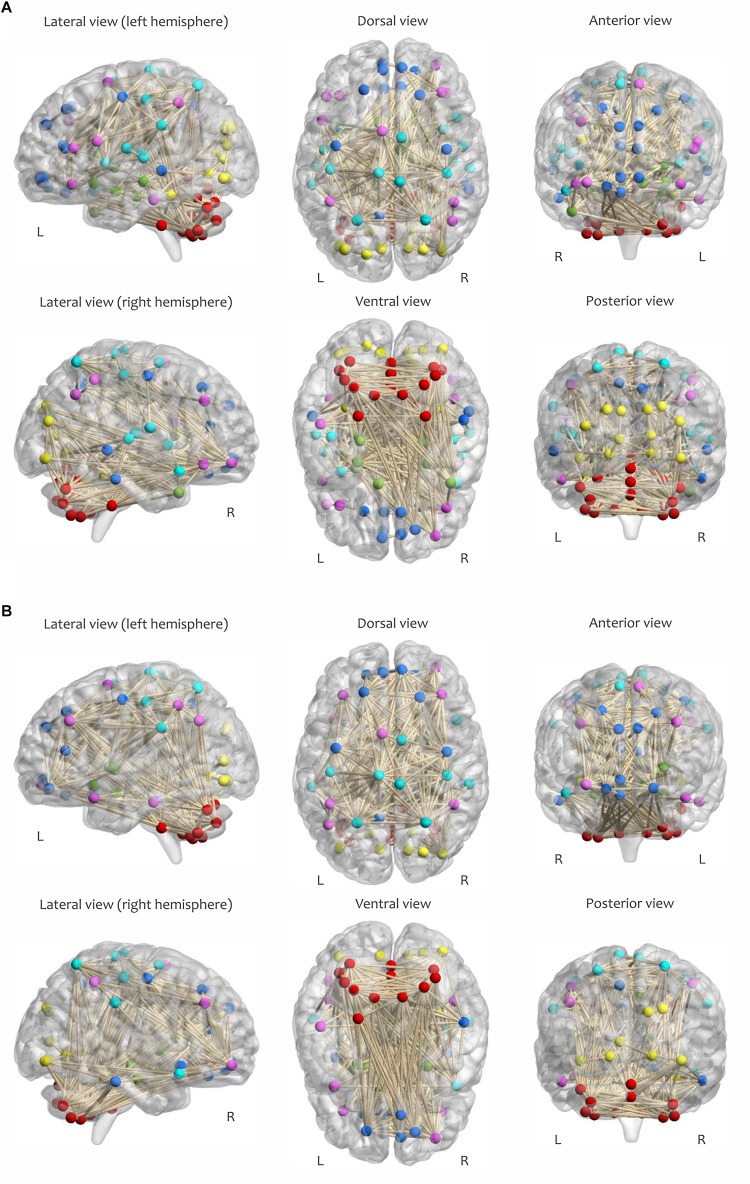
FIGURE 4.
Visualization of the adjacency matrix of a participant in (A) RW and (B) SR conditions at 2:00 PM, determined by maintaining the strongest connections at δ = 0.08. The sensorimotor network is cyan, the visual network is yellow, the frontoparietal network is magenta, the default mode network is blue, the subcortical/limbic system is green, and the cerebellar network is red.

