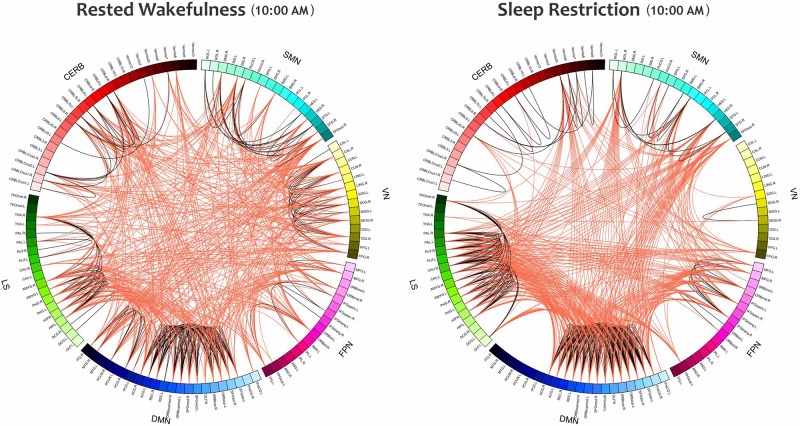
FIGURE 7.
The Connectograms of a participant in both conditions at the same daily time (10:00 AM) with the thresholding value of 0.08. The left and right figures are during RW and SR, respectively. The small-world index in the RW condition was 5.21, and this value decreased to 4.02 in the SR condition, thus indicating that the network underwent topological changes. These connectograms show the functional connections within or across the sensorimotor network, visual network, frontoparietal network, default mode network, subcortical/limbic system, and cerebellum. Each brain area is represented by a square on the circumference of the external circle. The lines connecting two squares represent the functional connectivity above threshold; red lines represent inter-network connections, and black lines represent intra-network connections. This graphical representation of connectomics was created in Circos (http://circos.ca/). SMN, sensorimotor network; VN, visual network; FPN, frontoparietal network; DMN, default mode network; LS, limbic system; CERB, cerebellar network.

