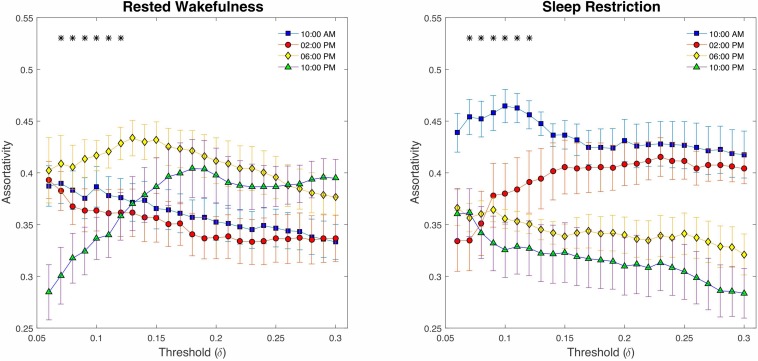
FIGURE 8.
Graph assortativity analysis using fixed cost thresholds (# 25, between δ = 0.06 and δ = 0.3). At the low-range cost thresholds (0.07 < δ < 0.12), both conditions showed a significant decline across daily sampling intervals for the assortativity metric. No meaningful differences were found at the high cost thresholds (δ > 12).

