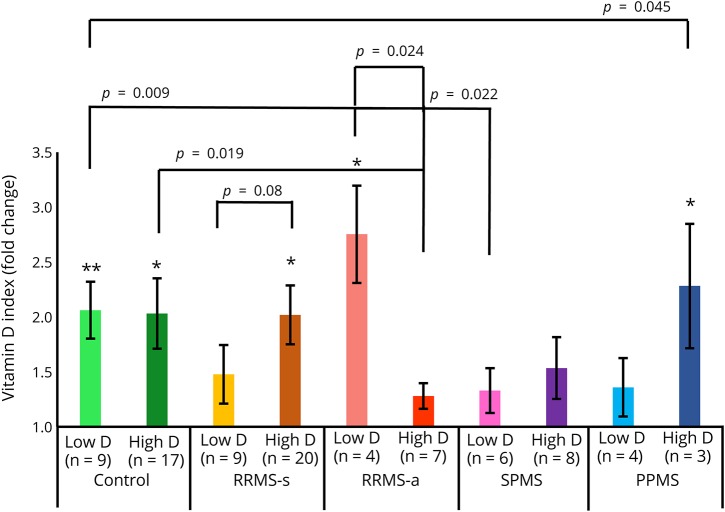
Figure 4. Effect of high vs low serum vitamin D levels from therapy-naive patients with MS on IFN response in MNCs in vitro.
Vitamin D plus IFN-β–induced p-Y-STAT1 expression is quantitated with flow cytometry. The median vitamin D level for the entire cohort was 30; low < 30, high ≥ 30 ng/mL 25-OH vitamin D. Methods and calculations as in figure 2. *p < 0.05, **p < 0.01. RRMS-a = active relapsing/remitting MS; RRMS-s = stable RRMS; PPMS = primary progressive MS; SPMS = secondary progressive MS.

