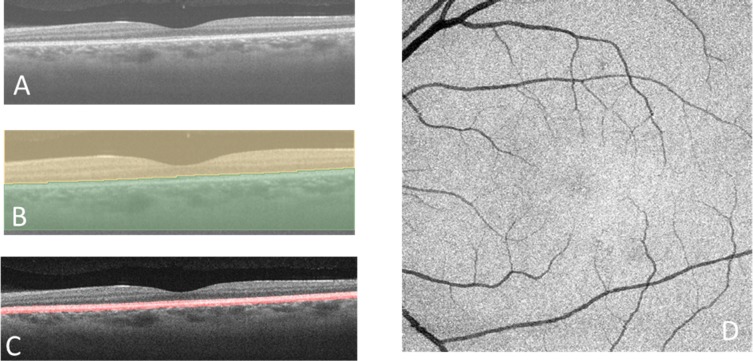
Figure 2.
Segmentation of the RPE complex and removal of the retinal vessel shadow. (A) Horizontal scan from the SS-OCT. (B) Segmentation using the grow-cut module in the 3D slicer software. The brown area indicates the side containing the sensory retina, and the green area indicates the side containing the RPE and choroid. There is a segmented line along the surface of the RPE. (C) The RPE complex (red outline) extends between the line on the surface of the RPE and the line 5 pixels (about 60 μm) beneath the RPE. (D) A maximum intensity Z-projection image of the RPE complex.

