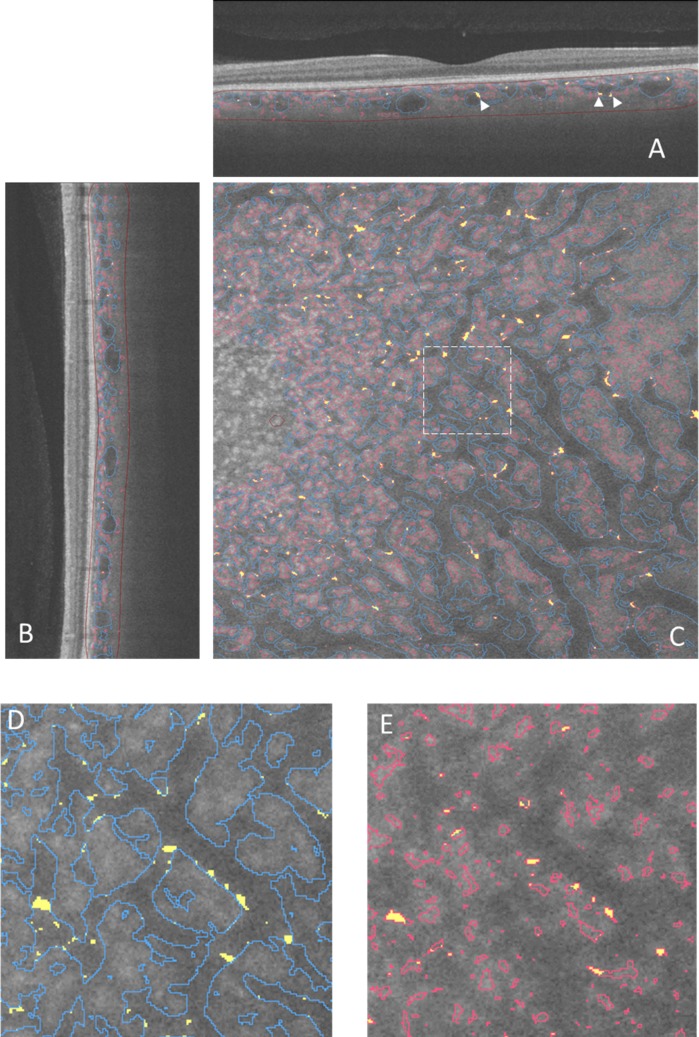
Figure 3.
Vessel segmentation in an image slice. The vessel images are overlaid on a slice from OCT-S. The red line in each panel shows the vessels detected on OCT-A, and the blue lines show the vessels detected on OCT-S. Yellow areas show overlap of the vessel made by OCT-A and OCT-S. (A) Horizontal slice. Arrowheads indicate the intersection between the vessels in OCT-A and OCT-S. (B) Vertical slice. (C) En face slice. A dashed line rectangle showed the area magnified in (D) and (E). The partial overlap between the small vessels and the large vessel appeared at the border of the large vessels. The brown lines in (A) and (B) outline the outer choroidal volume.

