
Figure 1.
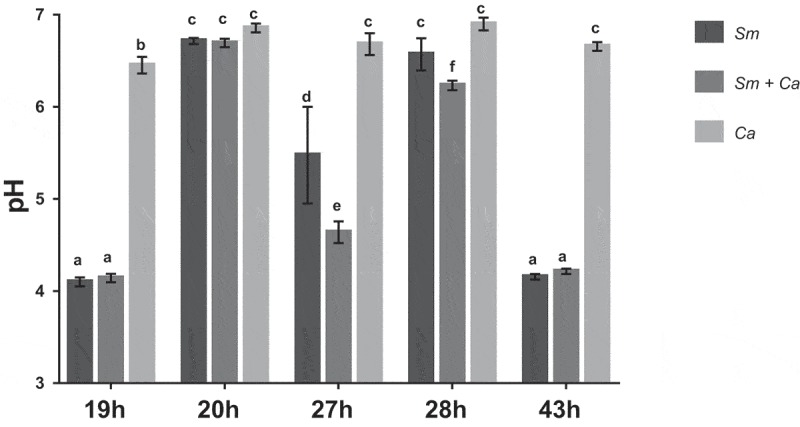
pH of the spent culture media at distinct developmental phases of biofilms. The data represent means and standard deviations (n = 12). Sm: S. mutans, Ca: C. albicans. Equal letters indicate statistically equal means by the Tukey test (p ≥ 0.05; two-way ANOVA, followed by Tukey test).