
Figure 8.
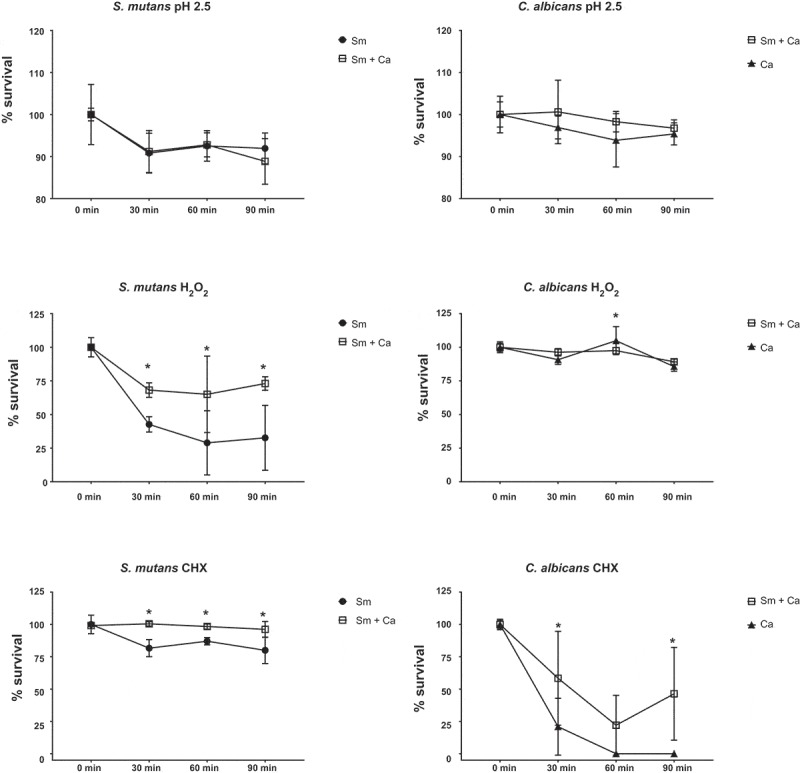
Stress tolerance of S. mutans and C. albicans in dual- and single-species biofilms. 43 h-old biofilms were longitudinally exposed (0, 30, 60 and 90 min) acid (pH 2.5), oxidative (0.2% H2O2) and antimicrobial (0.12% CHX) stresses. Data represent average and standard deviation of CFU/mL in percentage. *denotes statistical difference between a microbial species survival in dual- and single-species biofilms at a specific exposure time (two-way ANOVA, followed by Sidak’s multiple comparison tests). Statistical differences for the same biofilm type and per microorganism over time are not shown in the graphs but described in the main text. Sm: S. mutans and Ca: C. albicans.