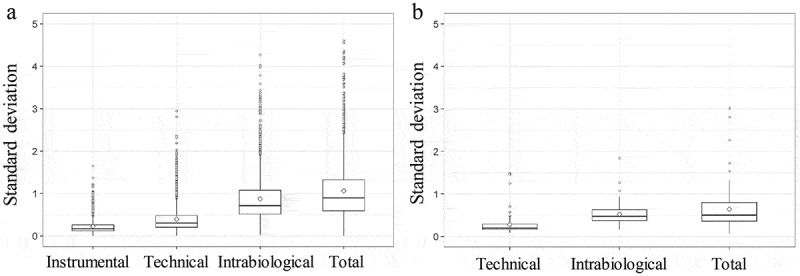
Figure 4.

Boxplot of standard deviation (SD) of normalized log intensity of the different variation set-ups. (a) SD of the instrumental, technical, intrabiological and total variation is shown for the proteomic data. (b) SD of the technical, intrabiological and total variation is shown for the lipidomic data.
