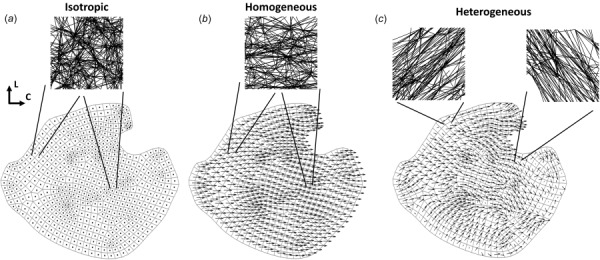
Fig. 2.

An example of the three different network cases used for each sample. The 2D finite element mesh is shown, with a quiver plot of fiber orientation overlaid on each element. Quiver plot arrows indicate the fiber direction, and the arrow length corresponds to degree of alignment (i.e., dots indicate no degree of alignment (isotropic), while longer arrows indicate higher degree of alignment (homogeneous and heterogeneous)): (a) the same isotropic network was used for every element in the isotropic case, where the network had no degree of alignment, (b) likewise, the same network was used for every element in the homogeneous case, where the network was now aligned in the average fiber direction, with the average degree of alignment in that direction. In the example shown here, the average fiber direction is close to the circumferential direction, and (c) different networks were used for each element in the heterogeneous case, where networks were constructed based on local fiber orientations and degrees of alignment for each element.
