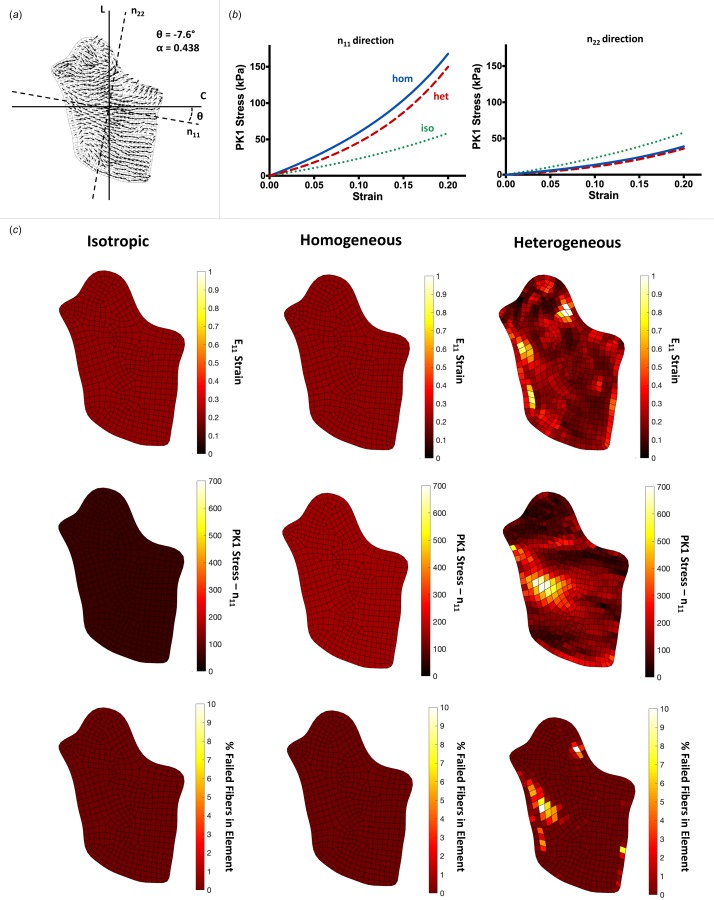
Fig. 3.

A representative, comprehensive analysis of the data, shown for an image with a high degree of alignment: (a) the 2D mesh and quiver plot is shown for the sample, where the n11 direction indicates the average fiber orientation for the sample, and the n22 direction is perpendicular to n11. The angle relative to circumferential (θ) and the degree of alignment (α) are shown, (b) averaged macroscale stress plots shown in the n11 (left) and n22 (right) directions for each of the three cases, isotropic (green, dotted line), homogeneous (blue, solid line), and heterogeneous (red, dashed line). For highly aligned samples, the homogeneous case was more anisotropic on average, displaying higher stresses than the heterogeneous or isotropic stress for the n11 direction, but lower stresses in the n22 direction, and (c) heatmaps shown on the sample for the isotropic (left column), homogeneous (middle column), and heterogeneous (right column) cases, displaying the E11 strain (top row), PK1 stress in the n11 direction (P11, middle row), and % of fibers failed in each element (bottom row). Isotropic and homogeneous cases displayed homogeneous strain, stress, and fiber failure throughout all of the samples, while the heterogeneous case experienced localized areas of high strain, stress, and fiber failure.
