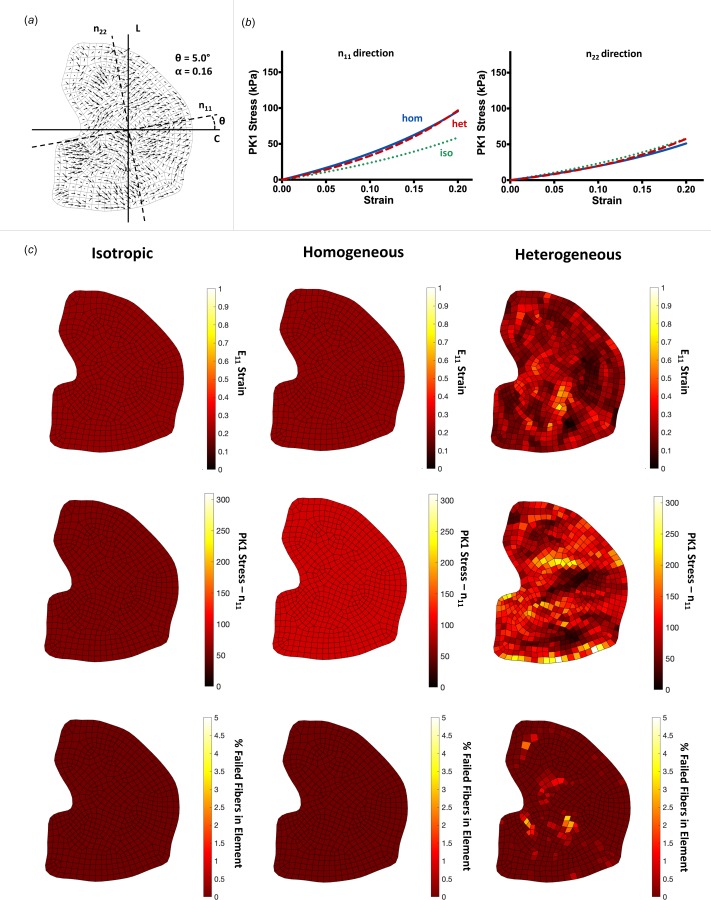
Fig. 4.

A representative analysis of the same from as Fig. 3, shown for a sample with degree of alignment: (a) the quiver plot shows a lesser degree of preferred fiber angle and degree of alignment, (b) averaged macroscale stresses are very similar between the three network cases for both the n11 and n22 directions. The amount of anisotropy is similar between the homogeneous and heterogeneous samples, on average, and (c) heatmaps shown again for each of the network cases. As in the highly aligned images, the isotropic and homogeneous cases display homogeneous strains, stresses, and fiber failure. The heterogeneous case shows the same trend as the highly aligned case, to a lesser degree. The maximum strain, stress, and % of failed fibers are lower in cases with low degree of alignment.
