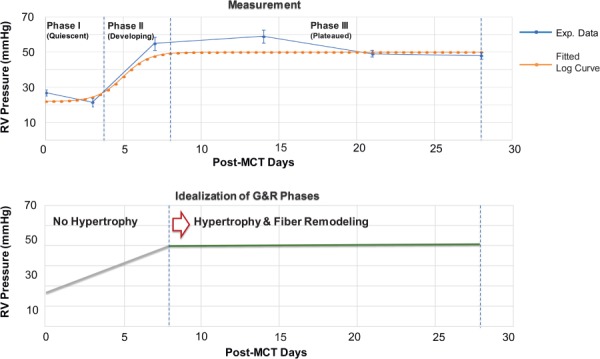
Fig. 3.

The evolution of the peak systolic pressure in the RV post MCT injection. (top) The RV pressure measured in MCT rats (with the dose of 60 mg/kg body wt) [37]: control (n = 12), day 3 (n = 12), day 7 (n = 5), day 14 (n = 6), day 21 (n = 5), and day 28 (n = 5). (bottom) Idealized evolution of the RV pressure with volumetric growth and fiber remodeling events.
