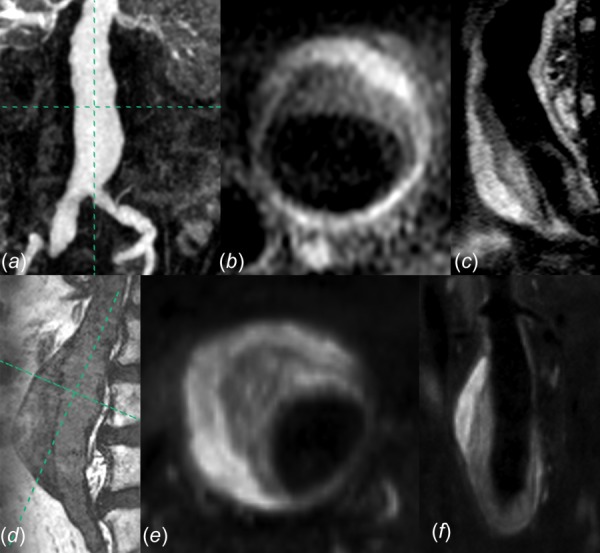
Fig. 1.

(a) Coronal maximum intensity projection image of MRA for AAA-3, with axial (b) and sagittal (c) T1 weighted imaging demonstrating ILT heterogeneity. (d) Sagittal TrueFISP image of AAA-2, with axial (e) and coronal (f) T1 weighted imaging demonstrating ILT heterogeneity.
