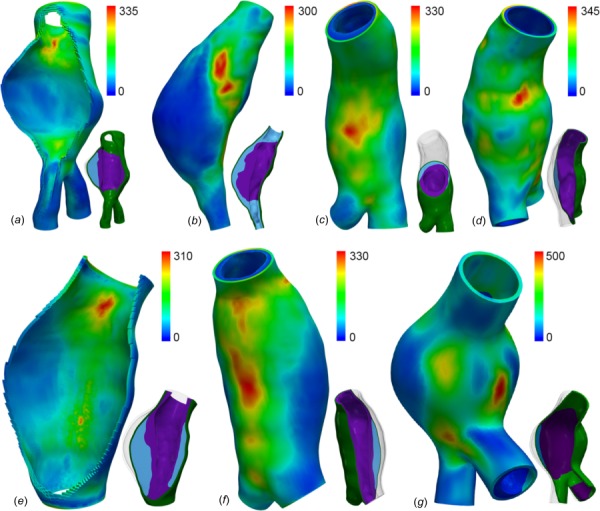
Fig. 5.

Von Mises stress (kPa) distributions for AAAs 1–4 (a)–(d) and 5–7 (e)–(g) in the high ILT stiffness disparity paradigm. To the lower right of each stress plot, a cutplane visualization of the model gives an impression of the ILT type distribution: inner = stiffer ILT (SFavg), outer = weaker ILT (Wkavg).
