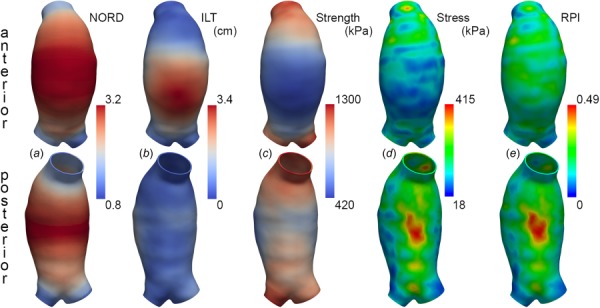
Fig. 7.

Determinants of RPI for AAA-6 in the low ILT stiffness disparity paradigm, with inner ILT layer represented by and the outer ILT layer represented by From left to right: (a) local diameter normalized to expected diameter for sex and age (NORD), (b) local ILT thickness, (c) wall strength (kPa) distribution, (d) Von Mises wall stress (kPa) distribution, and (e) RPI.
