
Fig. 1.
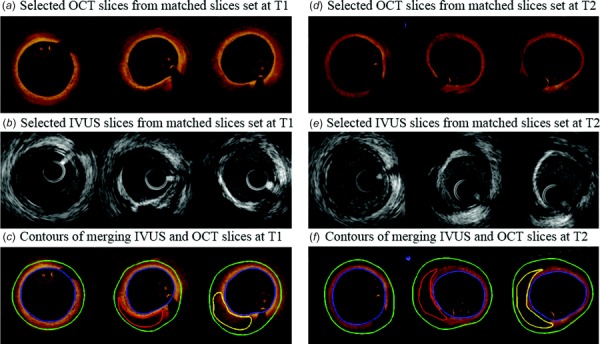
Samples of paired IVUS and OCT images at T1 and T2 with segmented contours. Contour color: blue lumen contour, green out-boundary, red lipid contour, yellow calcification.
Official websites use .gov
A
.gov website belongs to an official
government organization in the United States.
Secure .gov websites use HTTPS
A lock (
) or https:// means you've safely
connected to the .gov website. Share sensitive
information only on official, secure websites.
Samples of paired IVUS and OCT images at T1 and T2 with segmented contours. Contour color: blue lumen contour, green out-boundary, red lipid contour, yellow calcification.