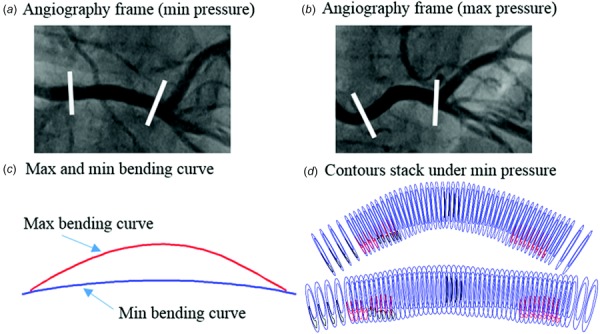
Fig. 2.

Curvature variation data from angiography of right coronary artery. (a) The angiography image with minimum pressure. (b) The angiography image with maximum pressure. (c) Vessel bending curves with maximum and minimum curvature. (d) Stacked contours plot with minimum and maximum pressure. Contour color: red lipid, black calcification, blue lumen, and out-boundary.
