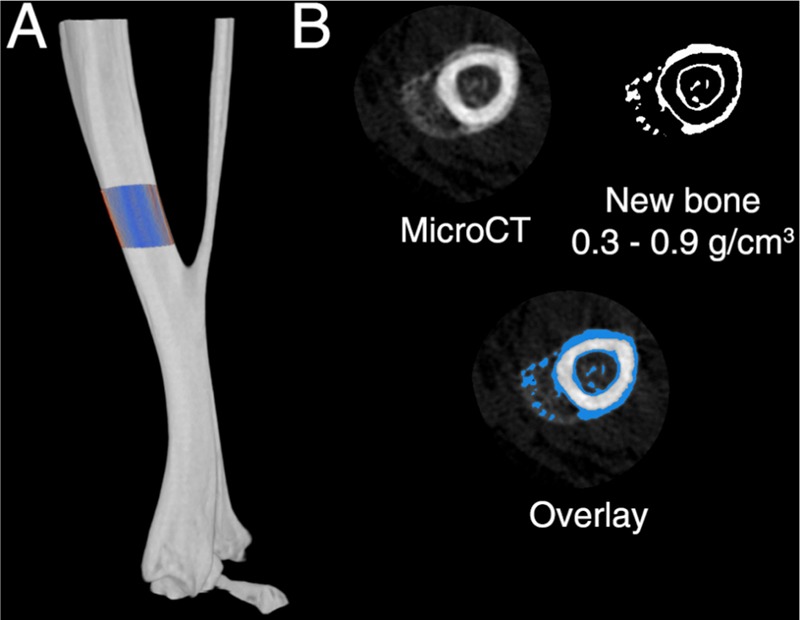
Fig. 1.

MicroCT analysis regions to assess new periosteal bone formation. (a) The region of interest (ROI) that was chosen, a 1.2 mm region located 0.5 mm above the tibial-fibular junction. (b) Within the ROI, a threshold of 0.3–0.9 g/mm3 bone density was used to define new bone. The overlay demonstrates the new bone threshold as compared to the raw microCT slice.
