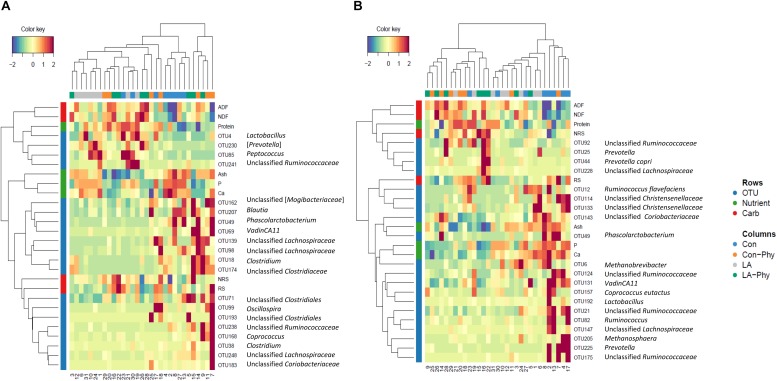
FIGURE 2.
Clustered Image Maps (Euclidean distance, complete linkage) of the multi-omics signature for the identified best discriminant operational taxonomic units (OTUs; n = 20; relative OTU abundance >0.04%), complex carbohydrates (RS, NRS, aNDFOM and ADFOM; n = 4) and nutrients in feces (protein, ash, Ca and P; n = 4) using sparse partial least square-discriminant analysis showing different enrichment between the treatment groups for (A) component 1 and (B) component 2. Con, control diet; LA, diet containing lactic acid- treated cereals; Con-Phy, diet with phytase supplementation; and LA-Phy, diet with phytase and lactic acid-treated cereals.

