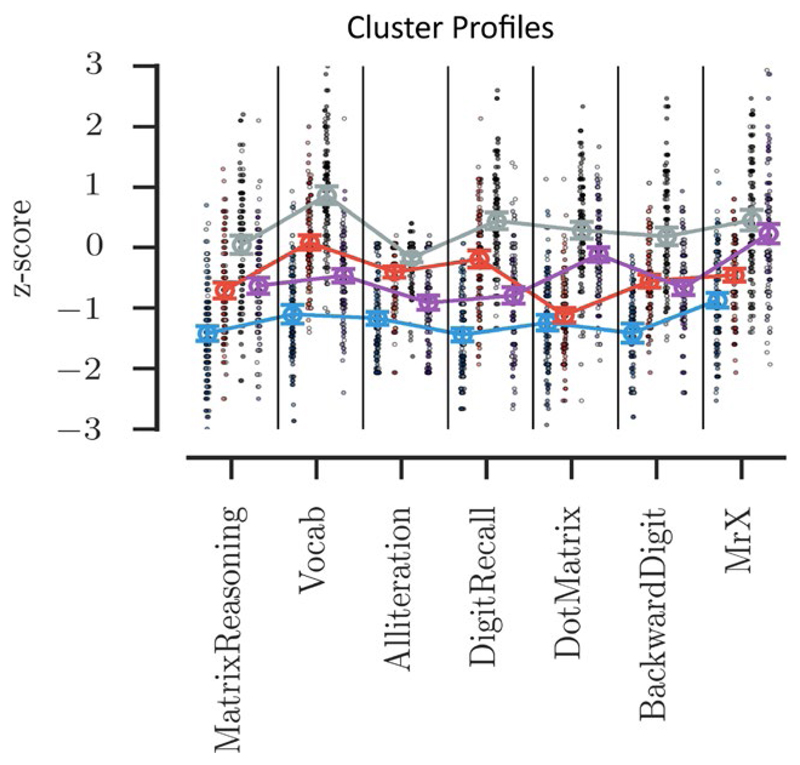
Figure 5.
The top panel shows the distributions of children assigned to each of the four clusters. Beneath each map the statistic indicates that all four clusters occupy a nonrandom set of nodes within the map. Beneath the maps the cognitive profile of each cluster is shown, ordered by cluster number. The scale indicates performance as a z score relative to age expected levels. The dots indicate individual children with the shade indicating the child’s consistency within that cluster over the 1,000 iterations—the darker the shade the more consistent the child

