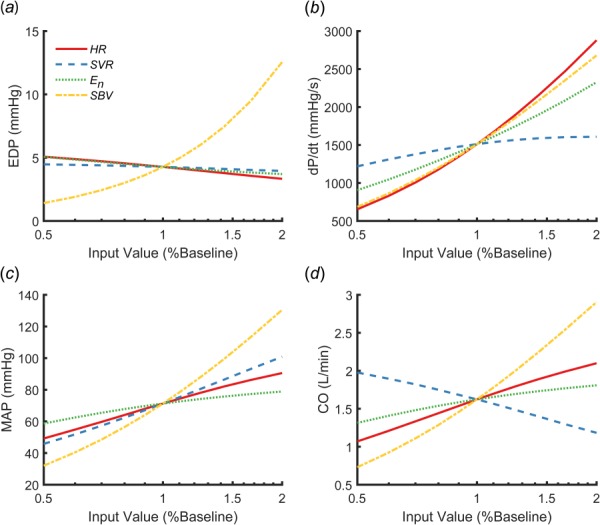
Fig. 2.

Sensitivity analysis showing how end-diastolic pressure (EDP) (a), maximum pressure generation (dP/dt) (b), mean arterial pressure (MAP) (c), and cardiac output (CO) (d) changed when heart rate (HR), systemic vascular resistance (SVR), peak end-systolic elastance (En), and stressed blood volume (SBV) were varied between 50% and 200% of the values reported by Santamore and Burkhoff [31]
