An official website of the United States government
Here's how you know
Official websites use .gov
A
.gov website belongs to an official
government organization in the United States.
Secure .gov websites use HTTPS
A lock (
) or https:// means you've safely
connected to the .gov website. Share sensitive
information only on official, secure websites.

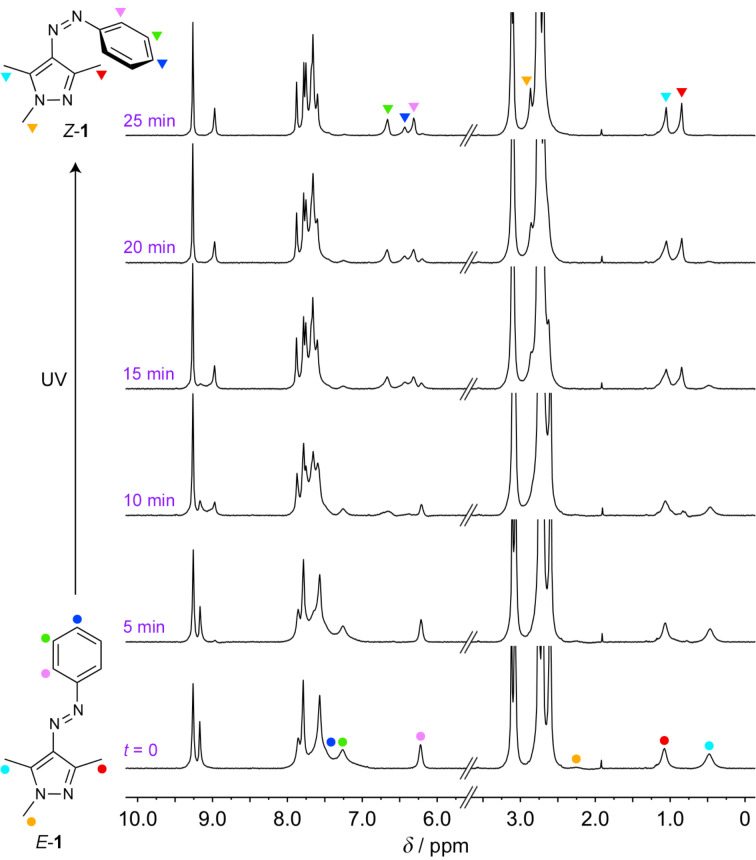
 2 (500 MHz, D2O, 298 K) before (bottom) and after exposure to UV light (λ = 365 nm) inside the NMR spectrometer (using an optical fiber) for different periods of time (indicated in purple font) for up to 25 min.