An official website of the United States government
Here's how you know
Official websites use .gov
A
.gov website belongs to an official
government organization in the United States.
Secure .gov websites use HTTPS
A lock (
) or https:// means you've safely
connected to the .gov website. Share sensitive
information only on official, secure websites.

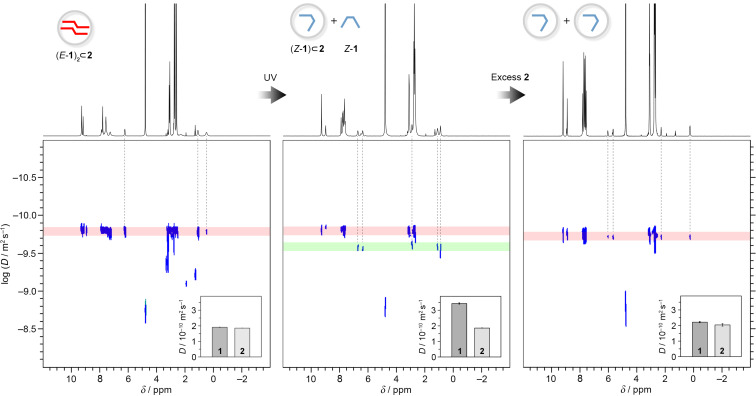
 2 (500 MHz, D2O, 298 K) before (left) and after (center) UV irradiation and after the addition of ~2.5 equiv of 2 (right). The vertical dashed lines denote the resonances of 1’s protons.